
In Part 1 we saw how to use Logstash to read a CSV file and prepare the data to send it to Elasticsearch. The data is in JSON fomrat and that's what Elasticsearch expects.
Now we will send JSON formatted data and see how we deal with the schema. If you send data to an Elasticsearch index, the first record that arrives is used to detrmine the schema. So Elasticsearch does a dynamic mapping. But this might not always work 100%. The alternative is to define a schema/mapping manually. We will have a look at both.
The geonames database I use has about 17 million rows. That takes a while to ingest, so I created a separate file, which only contains 10000 records. I will use this with logstash for this example. Also, I am running this on Linux, so if you use Windows it might work a little bit different in terms of commands and paths, etc.
Before we continue, make sure you installed Elasticsearch and also Kibana. Kibana is the frontend for creating visualizations and dashboards. Download the relevant packages for your operating system from the Elastic website, install them and then run both.
I named my Logstash file: geonames_1.yml and it is located in the Logstash config folder. The complete code is listed at the bottom of part 1 of this post. Adjust the path as appropriate for your system. I also changed the file to use the index "geonames_01" in Elasticsearch. To run it with Logstash do this:
Logstash takes a while to startup, and if everything runs well, the data is sent to Elasticsearch. Start your webbrowser and go to http://localhost:5601, if you have a local installation of Kibana. Once started, on the left lower side, click on the "Management" link, then under "Elasticsearch" click on "Index Management". You will get a list of available indexes. The index we just create is also there:

You can see that 10000 documents have been created in the index. Click on the name of the index and on the right side you get a popup with a summary. Click on the tab labeled "Mapping". It will show you a JSON representation of the dynamic mapping that Elasticsearch created when we imported the data.
If you read the first part, then you'll remember, that we made some type conversions. The CSV data comes all as strings and we converted e.g. "elevation" and "population" to number fields. All fields have been properly sent to Elasticsearch in their appropriate types. Even the "modification_date" was detected as a date field.
Now in Logstash we have converted the latitude and longitude position to a float value. And they are like this in the mappings file shown above. To make use of the geo-indexing features of Elasticsearch, the position field needs to defined as type "geo_point" in Elasticsearch.
Once the index mapping has been defined for a field, it can not be changed. So I will go ahead and delete the "geonames_01" index and we will manually add a different schema which properly maps the position field.
The popup where you saw the definition of the mapping for our index has a button labeled "Manage". Click on it and then select "Delete Index" to delete it.
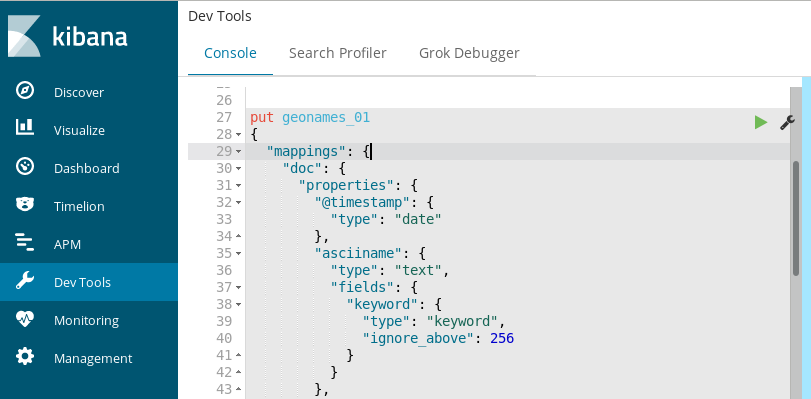
Click on the "Dev Tools" link on the left side of the browser window. Per default you will be on the "Console" tab. In the left part of the console paste the code from below:
Now in Logstash we have converted the latitude and longitude position to a float value. And they are like this in the mappings file shown above. To make use of the geo-indexing features of Elasticsearch, the position field needs to defined as type "geo_point" in Elasticsearch.
Once the index mapping has been defined for a field, it can not be changed. So I will go ahead and delete the "geonames_01" index and we will manually add a different schema which properly maps the position field.
The popup where you saw the definition of the mapping for our index has a button labeled "Manage". Click on it and then select "Delete Index" to delete it.
Click on the "Dev Tools" link on the left side of the browser window. Per default you will be on the "Console" tab. In the left part of the console paste the code from below:
The code tells Elasticsearch to create a new index with the given mapping. I have only changed the "position" field as discussed above to the following value:
Elasticsearch will understand that the geo_point type field will have a latitude and a longitude value attached and index it appropriately.
Still in the "Console" tab, click on the green icon to execute the code.
Still in the "Console" tab, click on the green icon to execute the code.
Note: If you go back to the management page you won't find the index there - not yet. As there are no documents in the index, it is not shown.
So let's go back to Logstash and run the config file once again.
So let's go back to Logstash and run the config file once again.
After Logstash started and after a short time, you will find the data again in Kibana as discussed above. If you go to the management view and look at the mapping defined for the index, you will see that now the position with latitude and longitude is properly mapped to the "geo_point" type.
That's all for the second part. The third part will concentrate on creating visualizations and a dashboard in Kibana on top of the data we imported.
Here is part 3:
Carpe Diem
That's all for the second part. The third part will concentrate on creating visualizations and a dashboard in Kibana on top of the data we imported.
Here is part 3:
Carpe Diem
 RSS Feed
