
This is the second post in the series to explain how the Tweakstreet ETL tool works. Here is the link to the first post of this series.
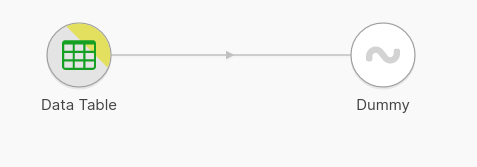
Let's have a look at the Data Table step we added last time. Double-clicking will reveal the details:
Let's have a look at the Data Table step we added last time. Double-clicking will reveal the details:
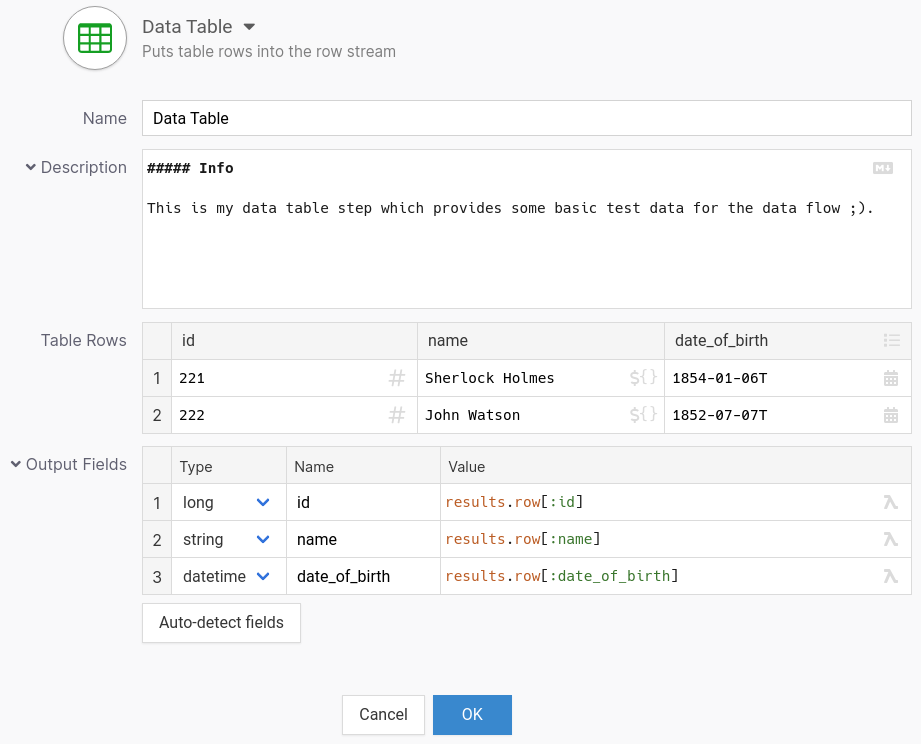
At the top when you click on the name, there is a drop down menu with some options. One of them is "Help" to display the documentation for the step. You can also just simply press F1 to display it.
Next comes the name of the step. I recommend to add a little bit more detail to the name so you can uniquely identify each step. And next comes the description field. You can write a detailed description of what the step does. The format to be used is Markdown and you have many possibilities to format the text, add lists, links, images, diagrams and much more. In the upper right hand corner of the description field you can click on the icon to choose how the markdown text should be presented to you: just the editor, with a preview or only the preview. Look here for more details on the Markdown syntax. Once you have added the description and go back to the canvas, the step will have a yellow marker and you can hover over it to display the description.
Next comes the name of the step. I recommend to add a little bit more detail to the name so you can uniquely identify each step. And next comes the description field. You can write a detailed description of what the step does. The format to be used is Markdown and you have many possibilities to format the text, add lists, links, images, diagrams and much more. In the upper right hand corner of the description field you can click on the icon to choose how the markdown text should be presented to you: just the editor, with a preview or only the preview. Look here for more details on the Markdown syntax. Once you have added the description and go back to the canvas, the step will have a yellow marker and you can hover over it to display the description.
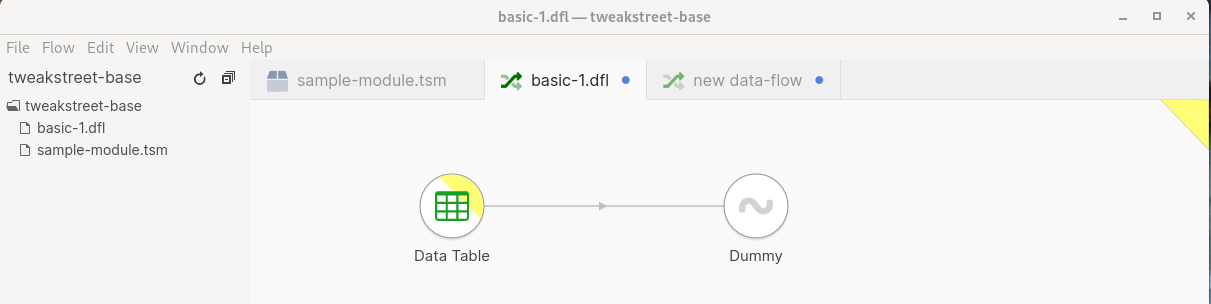
When you right click the canvas and select "Properties" (or Strg+T on the keyboard), a dialog is displayed to edit the properties of the data flow. This dialog also has a description field which can be used to add some text to describe the data flow as such. It works the same as discussed before. Back on the canvas, there is a yellow marker in the upper right hand corner in the tab of the data flow, as shown below.
Back to the Data Table Step... The "Table Rows" section is where the data is shown. By clicking on the header you can add, change, moce or delete columns. By right-clicking on the row number (the very left column) you get a menu to select from to add more rows. You can also use the standard cut/copy/paste way of duplicating rows. You may mark multiple rows with the mouse and then copy paste them. All very intuative.
Note that the "date_of_birth" column in this example is of type "datetime". If you right-click the column, and hover over "Morph To", you get a menu displayed with various data types. This is how you can change the type to e.g. a string, number, list, dict or something else. You can also select the field to be of type "formular" where you can add formulas or functions according to the Tweakflow expression language.
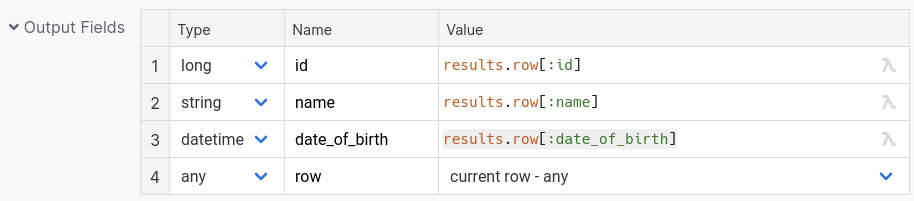
The last section to edit are the "Output Fields". Here you can select which details to output. There is a "results" object available and you can use the syntax shown to output the individual fields of each row. The individual rows are actually dictionaries and you can pass the name of the field to get its value:
Note that the "date_of_birth" column in this example is of type "datetime". If you right-click the column, and hover over "Morph To", you get a menu displayed with various data types. This is how you can change the type to e.g. a string, number, list, dict or something else. You can also select the field to be of type "formular" where you can add formulas or functions according to the Tweakflow expression language.
The last section to edit are the "Output Fields". Here you can select which details to output. There is a "results" object available and you can use the syntax shown to output the individual fields of each row. The individual rows are actually dictionaries and you can pass the name of the field to get its value:
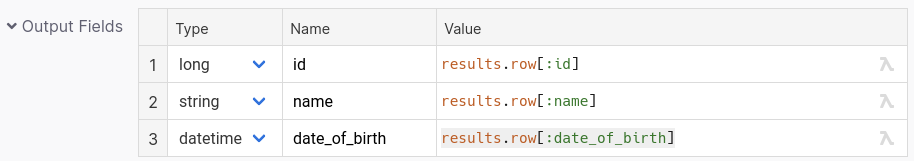
Another possibility is to output the complete row as a dictionary and not as individual fields. To do that, you can add another line to the output fields and give it a name - e.g. "row". Morph the value column (right click it and select "Morph To") to "result value" and then select "current row - any". It should look like this:
Click on ok and we are back on the canvas. Let's run this data flow: right click on the canvas and select "Run..." or "Run using last settings". The first one gives you the ability to change the run configuration - e.g. memory settings and logging level. The later one will simply run the flow. A new tab will open and the flow runs. If you having nothing selected (single-click on the canvas), you will get the results displayed at the bottom of the tab: you have an "Overview", "Log", "Metrics" and "Properties with various information about the run. If you click on a step, then the details of that step will be shown: number of records in and out and errors. If you click on the connection (hop) between two steps, then the actual data is displayed.
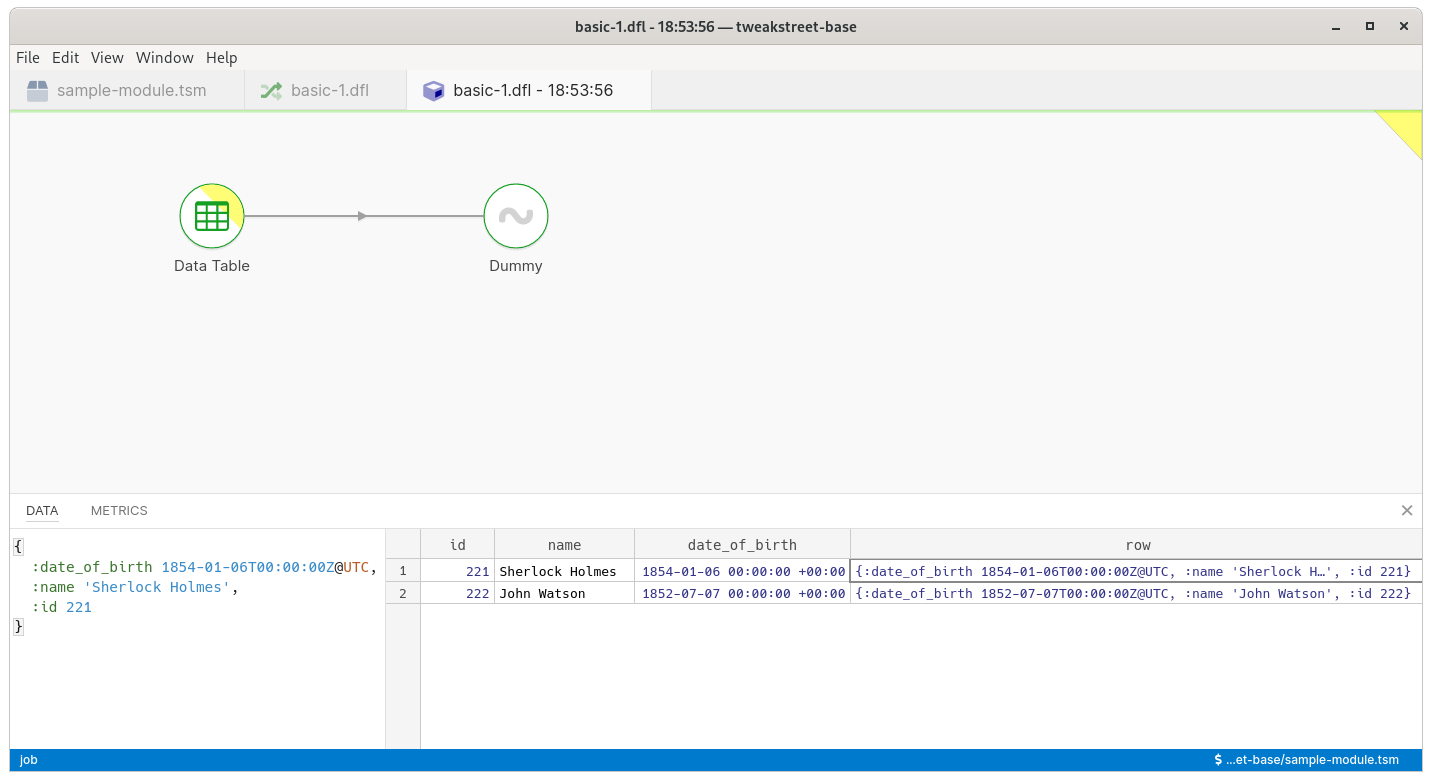
In the bottom right the data is displayed. If you select a field then the bottom left shows the value of the field. You can see that the three fields "id", "name" and "date_of_birth" are displayed. The last field which we named "row" further above shows the same information as the three fields, but in the form of a dictionary. So you can choose how the data should be handled depending on the use-case.
Next time we look at some more features of the UI and we will have a deeper look at some of the functions that are available.
Carpe Diem
Next time we look at some more features of the UI and we will have a deeper look at some of the functions that are available.
Carpe Diem
 RSS Feed
